We live in an age of plenty when it comes to information, which competes for attention from audiences who are increasingly time poor. More data is produced in a fortnight in 2023 than what was produced in the entire year of 2011.
Program evaluation faces a similar challenge. Communities and organisations are embracing evaluation at an increasing pace to ensure that their services are meeting the needs of their communities, and to demonstrate outcomes and value being delivered. However this evidence that is being generated faces a critical challenge — that of knowledge translation. It takes a long time for evidence that’s generated through research to influence policy or change practice(s), a frequently cited estimate indicates that this is about 17 years[1].
While this gap may have closed to an extent in the post-COVID era, there is still a pressing need to ensure that this gap continues to be minimised. To ensure that evidence and recommendations generated through research and evaluation are utilised effectively, these must be presented in a way that is accessible, engaging, and easy to understand for their intended audiences.
This is particularly important in the context of program evaluation, where the goal is to utilise evaluation results and recommendations to influence rapid changes in practice.
In this article, we will discuss the importance of visual storytelling through innovative knowledge products including findings videos, plain language resources, and dashboards, and innovative design approaches, in achieving this goal. It is also important to ensure the inclusion of people with lived experience in the design of these knowledge products, whether it is for crafting the message, or for use of appropriate language. This is central to how Larter develops knowledge products, and is articulated for example in our Indigenous evaluation strategy.
Findings videos are a great example of an innovative knowledge product. Videos can be used to present the key findings and if necessary, recommendations of a program evaluation in an engaging and accessible way. These are particularly useful for engaging stakeholders who may not have the time or interest to read through a lengthy evaluation report, and for targeting different audiences with sections of findings of relevance to them.
Videos can be presented in a variety of formats, some of which include:
- ‘Bite-sized’ summaries of findings, suitable for social media
- Clinician and consumer profiles (actual evaluation participants, or dramatised) sharing their experiences and outcomes
- Infographic videos with voiceover
- Comprehensive, yet short form videos which use a mix of graphics, text, voiceover as well as consumer and clinician voice.
Videos can also help to contextualise findings and contribute to research justice, particularly when people with lived experience, or program beneficiaries present the information. By presenting the information in a visually compelling way, and selecting the communication channel appropriately for the audience, findings videos can help to bridge the knowledge translation gap and ensure that evaluation results are used to inform practice.
Plain language resources are designed to present complex information in a way that is easy to understand. Plain language resources can take many forms, including fact sheets, infographics, and summaries. They are particularly useful for engaging stakeholders who may not have a background in the field of program evaluation and / or those who have lower levels of health literacy. By presenting information in a way that is easy to understand, plain language resources can help to ensure that insights emerging from evaluation are used to inform practice and can be disseminated more widely in print or digital form.
Larter produces plain language summaries of all evaluations which include data collection from consumers and community members.
Dashboards are another effective knowledge product that can help to bridge the knowledge translation gap. Data dashboards are collections of visual reports that display important metrics (such as demographic, service usage, and service satisfaction data) and measures against Key Performance Indicators (KPIs) and can be static (snapshot) or dynamic (real-time). These are particularly useful for:
- participatory evaluation approaches, allowing consumers to track program performance over time, identify trends and patterns, and highlight areas for improvement
- stakeholders who may be interested in tracking program performance but may not have the time or expertise to analyse detailed evaluation reports.
By presenting information in a visually engaging and interactive way, dashboards can help promote transparency and ongoing engagement.
The Larter difference
Larter designs and develops innovative knowledge products such as findings videos (for example, the Healthy Ageing mental health services in eastern Melbourne video, or the AOD Nurse Practitioners videos), plain language resources (such as the palliative Carers Support Kit or the Boon Wurrung Djiri Djiri service directory, and dashboards to help our clients share evaluation recommendations that stick. Sometimes the final products are implementation resources, such as:
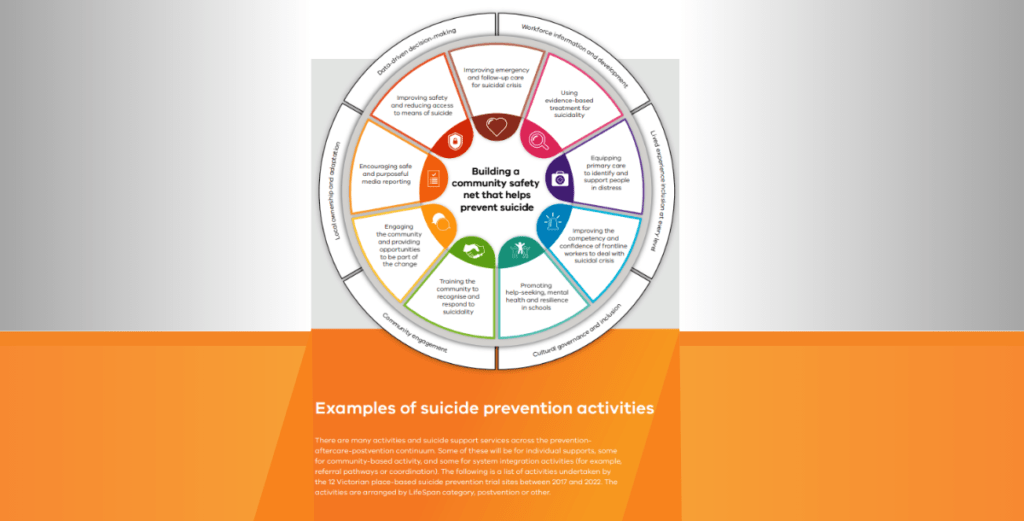
- Guide to Local Suicide Prevention
- Community health pride – LGBTIQ+ inclusive practice resources (toolkit and posters)
Funders and commissioning bodies in Australia are increasingly using innovative knowledge products to enhance the dissemination and use of their evaluation results.
If you are interested in understanding how utilisation-focused evaluation could help your health care program demonstrate your outcomes and impact, contact us for a conversation on 1800 527 837 or reach out at larter@larter.com.au.
[1] Morris ZS, Wooding S, Grant J. The answer is 17 years, what is the question: understanding time lags in translational research. Journal of the Royal Society of Medicine. 2011;104(12):510-520. doi:10.1258/jrsm.2011.110180

